為什麼Foglight for SQL Server無法顯示Deadlock兩天後的資料?
It seems some of the data is lost if
getting the data is from a deep tree path in foglight. We can try to re-get the
required data in the target dashboard. Please follow the below instructions:
5. Type "Monitoring:SQL Server Deadlock Data" in the text field next to "Output Data Type".
6. type "return deadlockData;" in the text area under "Script Text".
7. Click "Save" button on top to save the function.
5. In the popup dialog "Edit - Parameter {aDeadlockObservation}: XXX", click "..." button.
6. Type "getDeadLockData" in the search field and click on the return item, then click "Save" button.
7. In "Edit - Parameter {aDeadlockObservation}: XXX" dialog, go down the dropdown box next to "Path" select "DeadLock Data Obs - SQL Server Daeaklock Observation", then click "Set" button.
8. (See Edit_Deadlocks_view_3.png)in Edit - Context Entry "pprocessedData" dialig, click on the edit button of "Parameter {deadlockData} : of type Monitoring:SQL Server Deadlock Data", select "Context".
9. In the popup dialog "Edit - Parameter {deadlockData}: XXX", select "instance(SQL Server Instance)" on the dropdown box next to "Input Key".
10. Select "DeadLock Data - SQL Server Daeaklock Data" on the dropdown box next to "Path", then click "Set" button.
11. click "Set" button on Edit - Context Entry "pprocessedData" dailog, Click "Save" botton on top to save the view.


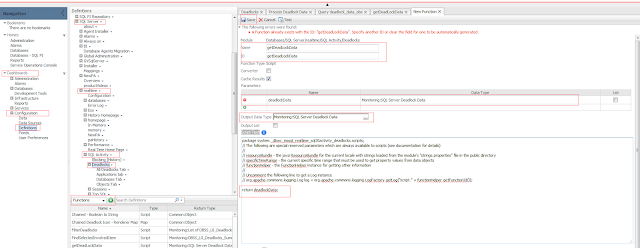
Add a new function by doing the follow
steps(see the attached Add_New_Function.png):
1. Expand Dashboards | Configuration |
Definitions | Databases | SQL Server |
realtime | SQL Activity | Deaklocks
2. On the dropdown box select
"Funcntions", click the green "+" icon. Select Blank
Function | Script on the pop-up
3. Type "getDeadLockData" in Name and
ID text field.
4. Click green "+" icon under
"Parameters", type "deadlockData" in Name cell and type
"Monitoring:SQL Server Deadlock Data" in Data Type cell.5. Type "Monitoring:SQL Server Deadlock Data" in the text field next to "Output Data Type".
6. type "return deadlockData;" in the text area under "Script Text".
7. Click "Save" button on top to save the function.

1. Go to the same path as add a new
function.
2. (See Edit_Deadlocks_view_1.png) On
the dropdown box select "View", click on the view named
"Deadlocks", then click "Edit" button
3. (See
Edit_Deadlocks_view_2.png)Click Edit button for property
"processedData", will pop up a dialog Edit - Context Entry
"processedData"
4. Click Edit button for the first
Parameter "aDeadlockObservation", select "Change to
Binding" | "Function"5. In the popup dialog "Edit - Parameter {aDeadlockObservation}: XXX", click "..." button.
6. Type "getDeadLockData" in the search field and click on the return item, then click "Save" button.
7. In "Edit - Parameter {aDeadlockObservation}: XXX" dialog, go down the dropdown box next to "Path" select "DeadLock Data Obs - SQL Server Daeaklock Observation", then click "Set" button.
8. (See Edit_Deadlocks_view_3.png)in Edit - Context Entry "pprocessedData" dialig, click on the edit button of "Parameter {deadlockData} : of type Monitoring:SQL Server Deadlock Data", select "Context".
9. In the popup dialog "Edit - Parameter {deadlockData}: XXX", select "instance(SQL Server Instance)" on the dropdown box next to "Input Key".
10. Select "DeadLock Data - SQL Server Daeaklock Data" on the dropdown box next to "Path", then click "Set" button.
11. click "Set" button on Edit - Context Entry "pprocessedData" dailog, Click "Save" botton on top to save the view.


Go the Database - Activity dashboard,
choose time range over 24h to check.


留言
張貼留言